The 2025 Atlantic hurricane season has officially entered above-normal activity levels, prompting meteorologists to sound alarms about the seven states with the highest historical hurricane exposure. NOAA’s Climate Prediction Center confirms that the season will see 13-18 named storms, with 5-9 developing into hurricanes and 2-5 reaching major hurricane status. The agency reports a 50% chance of above-normal activity through November 30, creating heightened concerns for states that have historically borne the brunt of Atlantic Basin storms.
Ocean Temperatures Fuel Unprecedented Storm Development Conditions
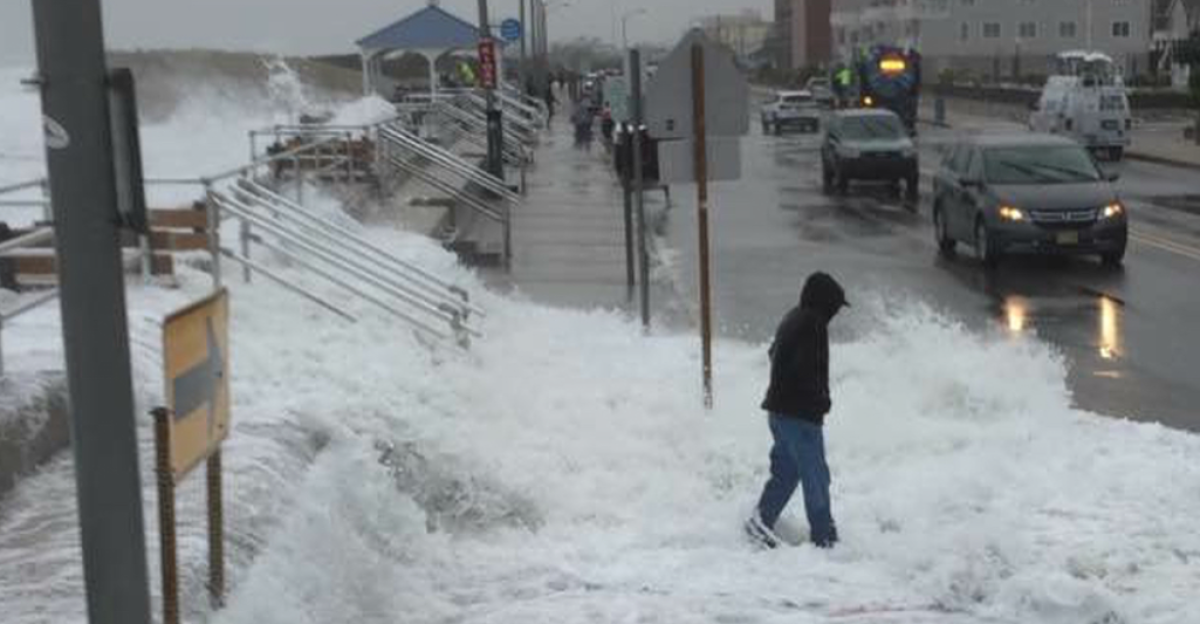
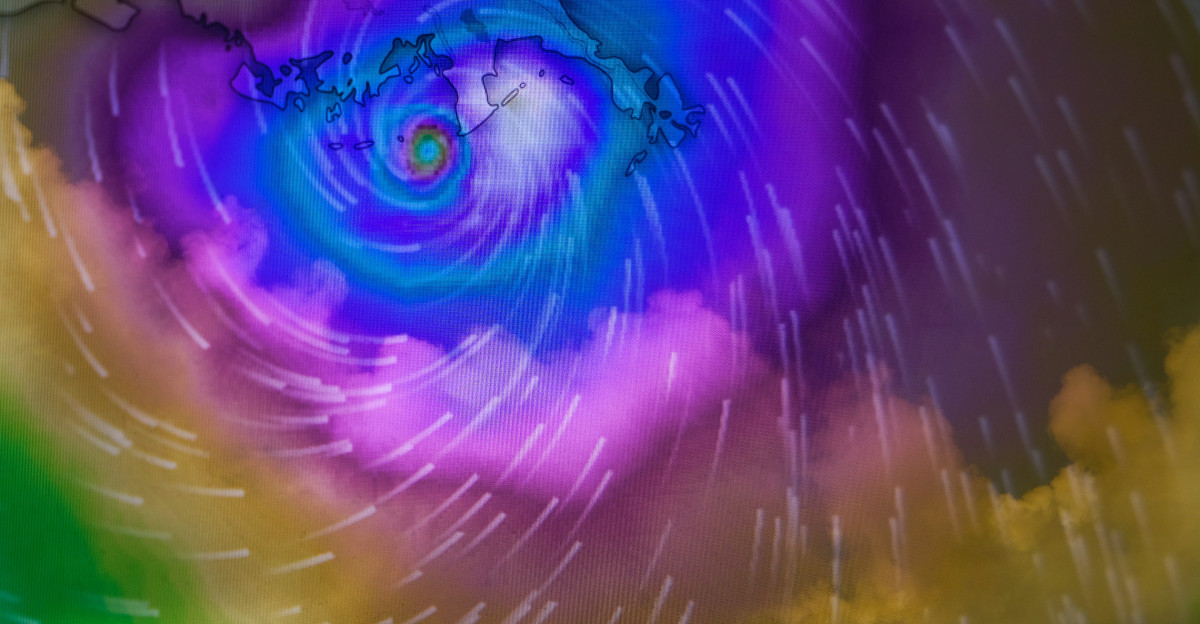
Sea surface temperatures across the Atlantic Basin run significantly above normal, creating ideal hurricane development and intensification conditions. The National Hurricane Center states that these warmer waters, combined with reduced wind shear patterns, set the stage for potentially explosive storm development. Climate Central research shows that human-caused climate change has made warm ocean waters up to 400 times more likely, with record-breaking temperatures commonly running more than 3°F above normal throughout the hurricane formation zones.
Historical Data Reveals Decades of Devastating Storm Patterns
Hurricane tracking data maintained by NOAA since 1851 shows clear patterns of which American states face the most significant hurricane exposure. The National Hurricane Center’s comprehensive hurricane database reveals that 305 Atlantic hurricanes have produced hurricane-force winds along the U.S. coast since systematic tracking began. This historical perspective becomes critical as communities prepare for another active season, with meteorologists using 172 years of data to understand long-term risk patterns and help residents make informed decisions about hurricane preparedness.
Multiple Climate Factors Align for Dangerous Hurricane Season
Colorado State University’s Tropical Meteorology Project reports that multiple atmospheric conditions are converging to create what researchers describe as optimal hurricane development conditions. Their latest forecast predicts 16 named storms, eight hurricanes, and three major hurricanes for the remainder of the season, representing 115% of average activity based on the 1991-2020 baseline. NOAA scientists explain that weakened El Niño patterns have removed one of nature’s primary hurricane suppression mechanisms, clearing the path for increased storm activity throughout the southeastern United States.
Seven States Lead Nation in Historical Hurricane Exposure
Historical analysis of NOAA’s Hurricane Database reveals seven states that have experienced the most hurricane impacts since 1851, making them the highest-risk areas for current and future storm activity. According to official National Hurricane Center records and multiple meteorological analyses, these states represent America’s most hurricane-vulnerable regions. Policygenius insurance analysis confirms these findings, showing that the same seven states consistently rank highest in historical hurricane frequency and current insurance risk assessments, creating a clear picture of America’s hurricane-prone coastline.
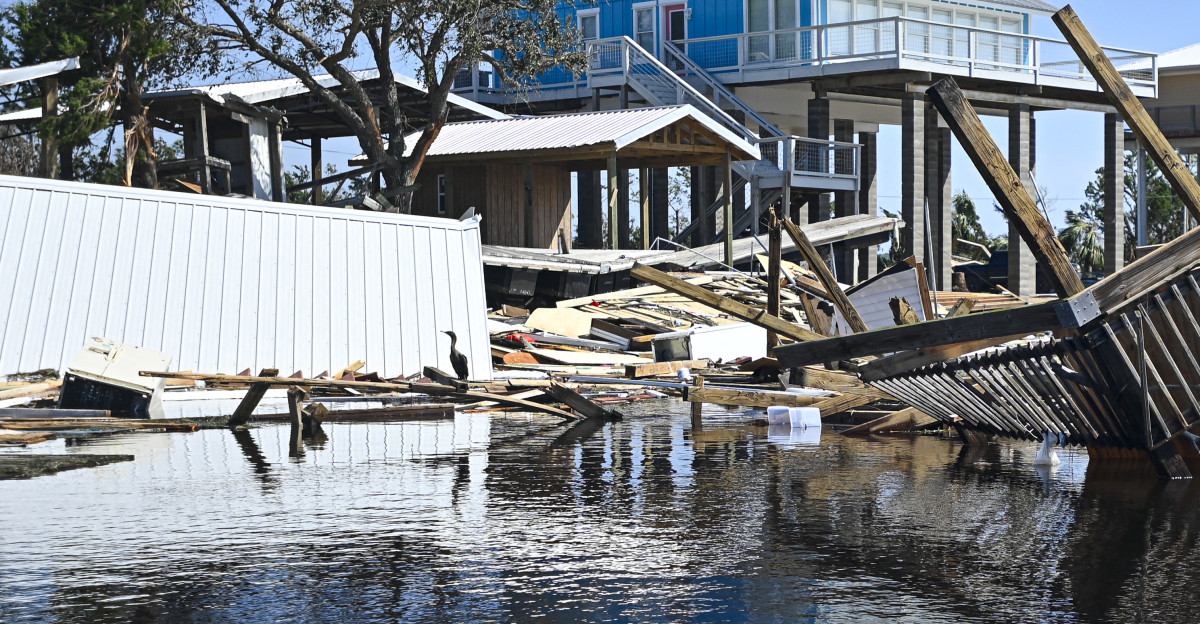
1. Florida Dominates Hurricane Statistics with 125 Total Strikes
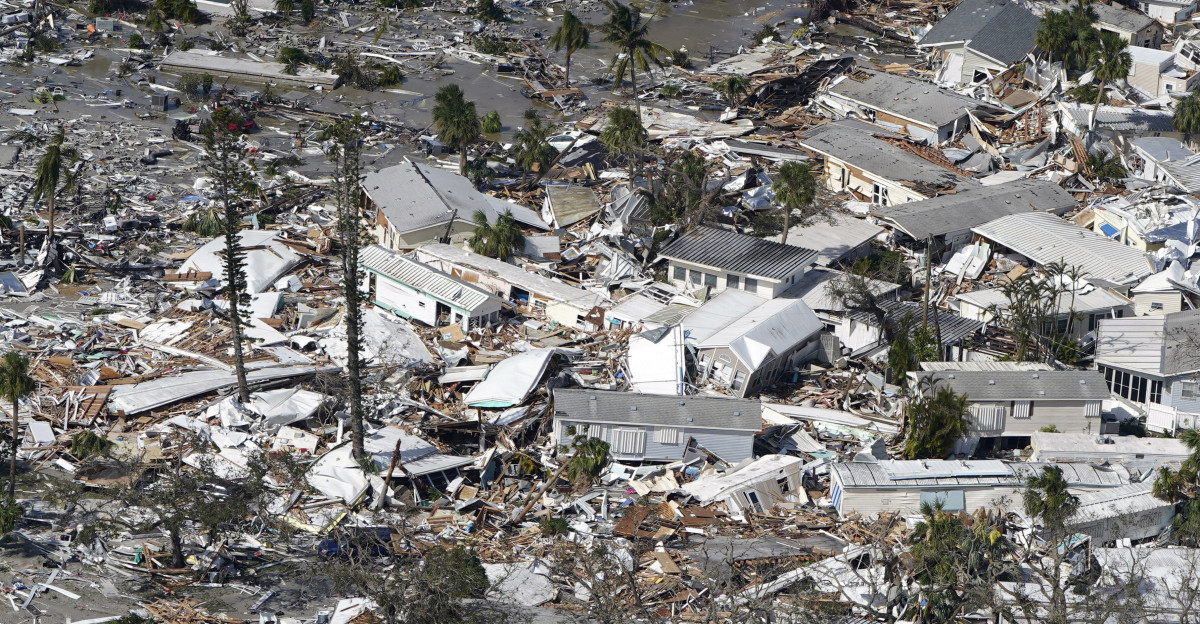
According to NOAA’s official Hurricane Database, Florida is America’s most hurricane-battered state, having endured 125 hurricane landfalls since 1851. Policygenius research confirms that Florida has experienced 40 major hurricanes (Category 3 or higher), with the state’s unique geography between the Atlantic Ocean and Gulf of Mexico making it a virtual hurricane magnet. The National Hurricane Center notes that more than 40% of all U.S. hurricanes have impacted Florida, including devastating recent storms like Hurricane Ian (2022), which caused catastrophic damage across the state and demonstrated Florida’s ongoing vulnerability to significant hurricane impacts.
2. Texas Ranks Second with 66 Hurricane Landfalls
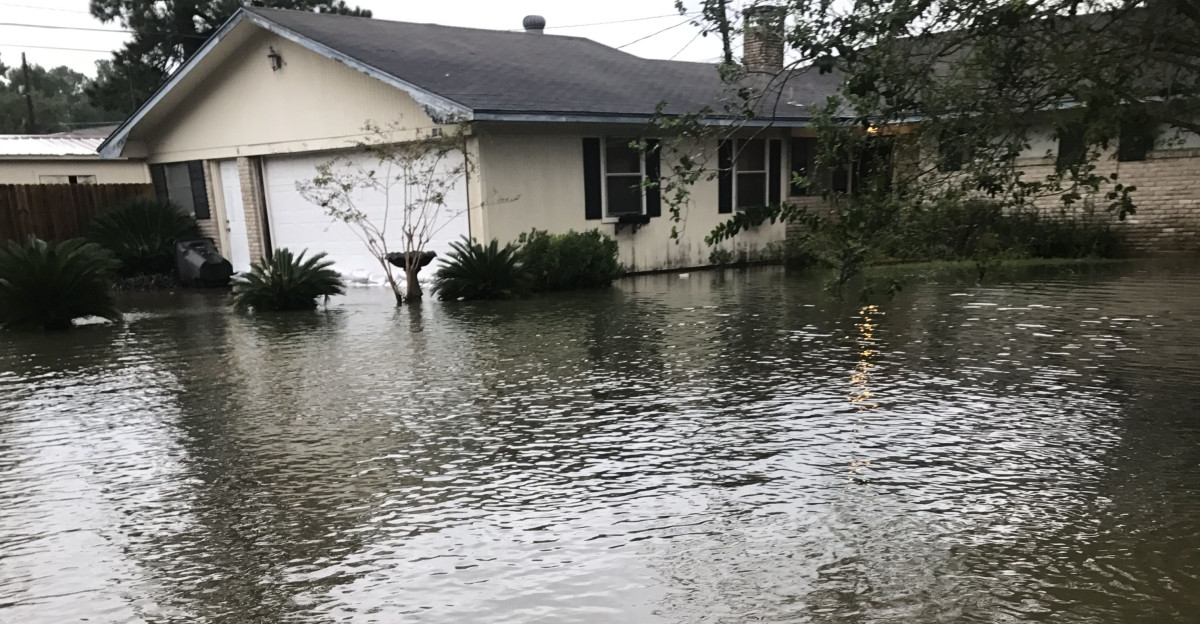
Texas is second in hurricane frequency, with 66 total hurricane strikes documented by NOAA since 1851. The National Weather Service Houston office confirms that 20 of these storms reached major hurricane status, including Hurricane Harvey in 2017, which dumped over 50 inches of rain and caused approximately $125 billion in damage. World Population Review analysis shows that Texas accounts for roughly one-fifth of all U.S. hurricanes, with the state’s extensive Gulf Coast coastline creating multiple vulnerable areas from Galveston to the Rio Grande Valley.
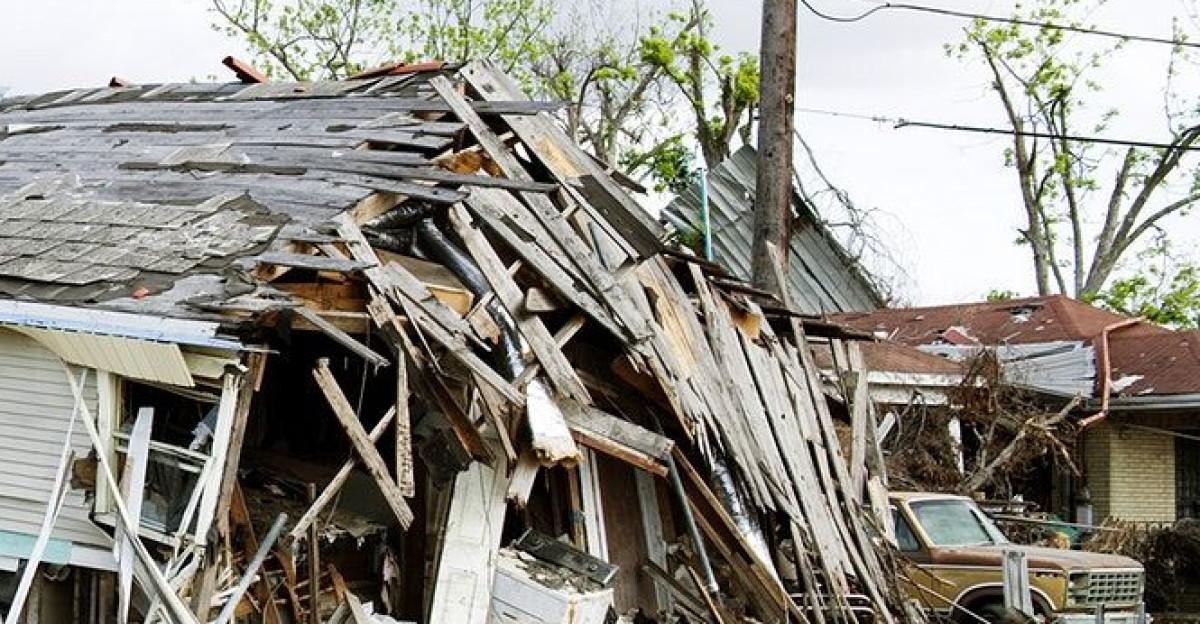
3. Louisiana Follows with 64 Hurricanes and Devastating Major Storms
According to NOAA’s comprehensive tracking data, Louisiana ranks third nationally with 64 hurricane strikes since 1851. The state has endured 19 major hurricanes, with Hurricane Katrina in 2005 representing the most catastrophic, killing nearly 1,600 Louisiana residents and causing approximately $108 billion in damage. Policygenius analysis shows that Louisiana accounts for about one-fifth of all U.S. hurricane activity, with the state’s low-lying coastal geography and critical petroleum infrastructure remaining in constant hurricane crosshairs throughout each storm season.
4. North Carolina Leads Non-Gulf States with 60 Hurricane Impacts
North Carolina is the most hurricane-vulnerable state outside the Gulf of Mexico region, with 60 documented hurricane strikes since 1851, according to NOAA records. The National Weather Service confirms that nine of these storms reached major hurricane status, including Hurricane Hazel in 1954, which produced an 18-foot storm surge and caused 19 deaths. Universal Property analysis notes North Carolina’s position along the Atlantic Coast makes it particularly susceptible to storms tracking northward from the Caribbean, with the Outer Banks serving as a frequent hurricane landfall point.
5. South Carolina Experiences 32 Hurricanes with Major Impact in History
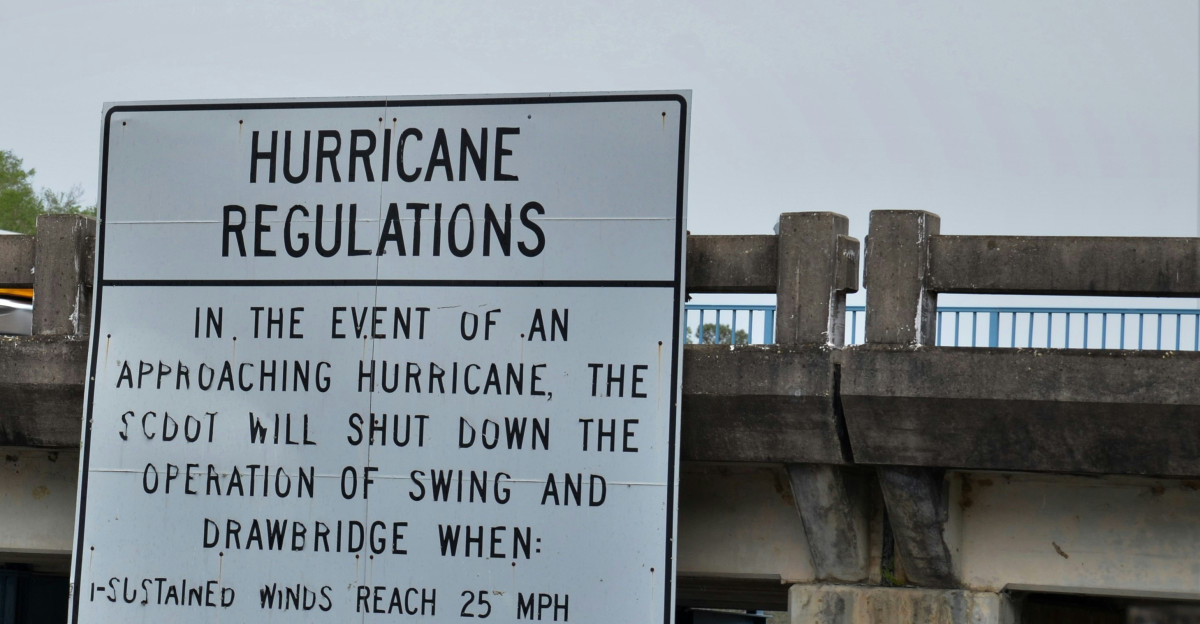
South Carolina ranks fifth nationally with 32 hurricane landfalls documented by the National Hurricane Center since 1851. The state has experienced six major hurricanes, including Hurricane Hugo in 1989, which made landfall as a Category 4 storm and produced the highest storm tide heights ever recorded along the U.S. East Coast. NOAA data shows that Hugo caused nearly $7 billion in damage, while more recent storms like Hurricane Florence in 2018 set new rainfall records and demonstrated South Carolina’s continued vulnerability to both wind damage and catastrophic flooding.
6. Alabama Records 26 Hurricane Strikes Despite Limited Coastline
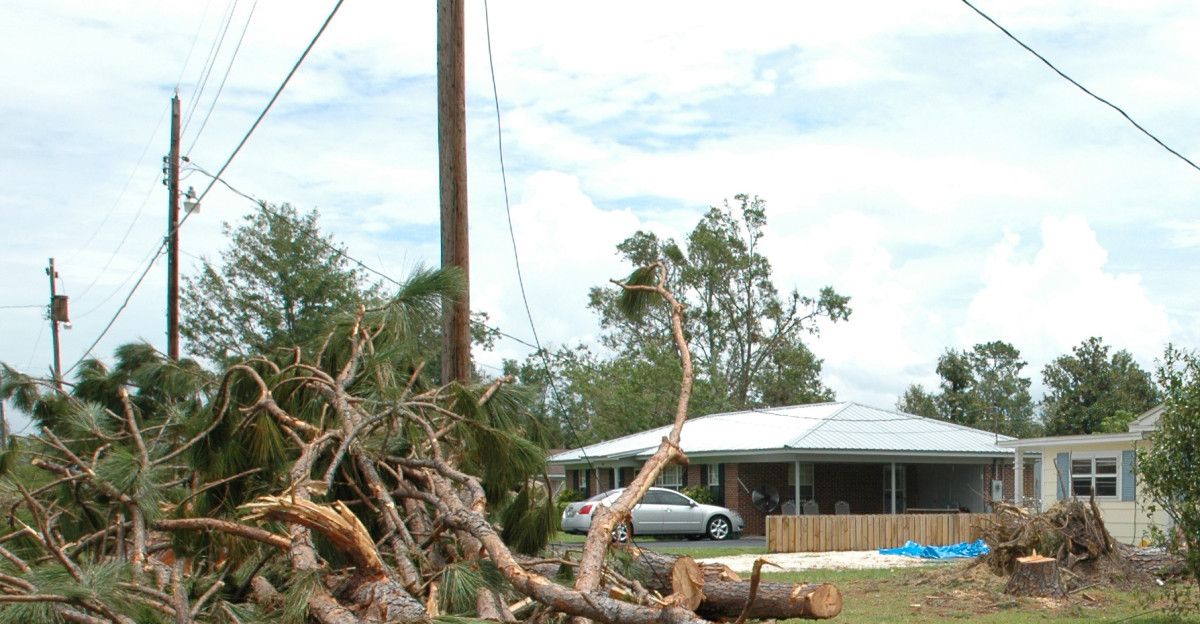
According to NOAA’s Hurricane Database, Alabama has documented 26 hurricane landfalls since 1851 despite having only 53 miles of coastline. The National Weather Service Mobile office reports that five of these storms reached major hurricane status, with Hurricane Katrina in 2005 producing 11-foot flooding in downtown Mobile. NASA Earth Observatory analysis shows that Alabama’s position along the Gulf Coast creates a natural hurricane funnel through Mobile Bay, concentrating storm surge and wind damage in densely populated coastal areas despite the state’s relatively short coastline exposure.
7. Georgia Completes Top Seven with 24 Hurricane Landfalls
According to NOAA records, Georgia rounds out America’s most hurricane-prone states with 24 documented hurricane strikes since 1851, five of which reached major hurricane status. The National Weather Service Atlanta confirms that Hurricane Irma in 2017 left 1.5 million Georgians without power, while recent Hurricane Helene in 2024 resulted in 37 deaths and demonstrated the state’s growing vulnerability. World Population Review data shows that Georgia’s hurricane impacts often result from storms maintaining strength as they move inland, creating widespread wind damage and power outages across the state’s heavily populated metropolitan areas.
Insurance Crisis Grips Hurricane-Prone States as Costs Skyrocket
The seven highest-risk hurricane states are experiencing a severe insurance affordability crisis. Axios reports that Louisiana leads the nation at $6,274 annually for home insurance, followed closely by Florida at $5,735. The National Association of Realtors confirms that states vulnerable to hurricanes consistently rank among the highest for insurance costs nationwide. Insurify data shows that Nebraska, Louisiana, and Florida face annual premiums nearly three times the national average of $2,470, with many coastal areas seeing hurricane deductibles rise to 5-10% of home values as insurers struggle with mounting catastrophic losses.
Climate Change Research Links Warmer Oceans to Stronger Hurricanes
Climate Central’s peer-reviewed research published in Environmental Research: Climate demonstrates that climate change intensified roughly 80% of Atlantic hurricanes between 2019 and 2023 by an average of 18 miles per hour. The Environmental Defense Fund reports that the proportion of significant hurricanes in the Atlantic Ocean has doubled since 1980, with warmer sea surface temperatures providing more energy for storm development. NASA climate scientists explain that hurricane rainfall rates increase by 10-15% for each degree of warming, creating more dangerous flooding conditions when storms make landfall in vulnerable coastal areas.
Federal Agencies Expand Hurricane Preparedness Resources

NOAA’s Office of Response and Restoration reports that nearly 40% of the U.S. population lives in coastal regions, making hurricane preparedness a critical national security issue. The agency established a Disaster Response Center in Mobile, Alabama, to coordinate regional hurricane response for the Gulf Coast states. FEMA has pre-positioned emergency supplies across the seven highest-risk states, with staging areas containing 3 million meals and 2.8 million liters of water. This represents a significant expansion of pre-disaster preparation efforts based on lessons learned from recent major hurricane impacts.
Rapid Intensification Becomes a More Common and Dangerous Phenomenon
Climate Central analysis shows that 70% of the 63 billion-dollar tropical cyclones in the U.S. since 1980 underwent rapid intensification, making them particularly challenging to forecast and prepare for. The National Hurricane Center reports that rapidly intensifying storms can strengthen by 35 miles per hour or more within 24 hours, often catching coastal communities with insufficient warning time. Research indicates that three storms strengthened into Category 5 hurricanes specifically because of climate change: Lorenzo (2019), Ian (2022), and Lee (2023), demonstrating how climate factors are creating more dangerous storm conditions.
Congressional Action Addresses Growing Hurricane Infrastructure Needs

House Committee on Transportation and Infrastructure representatives from the seven highest-risk states are pushing legislation allocating $50 billion for pre-disaster mitigation projects. The proposed Hurricane Resilience Act would fund improved evacuation routes, stronger building codes, and early warning systems targeting the most historically vulnerable areas. Congressional testimony shows that current evacuation infrastructure cannot handle rapid population growth in coastal areas, with traffic modeling revealing potential 12-hour delays for complete coastal evacuations during major storms, creating life-threatening bottlenecks during emergencies.
International Hurricane Research Partnerships Expand Data Sharing

The World Meteorological Organization reports that Caribbean nations are experiencing similar increases in hurricane activity, with enhanced international cooperation improving global forecasting accuracy. NOAA participates in expanded data-sharing agreements that help meteorologists understand storm development patterns across the Atlantic Basin. These partnerships have contributed to significant improvements in hurricane track prediction, with the National Hurricane Center achieving 7-day landfall predictions with 70% accuracy, compared to 50% accuracy just five years ago, giving communities more time to prepare for approaching storms.
Hurricane Damage Costs Reach Record Levels Across Vulnerable States
The Insurance Information Institute reports that the 2017 hurricane season caused more than $200 billion in damages, making it the costliest on record for the United States. Congressional budget analysis shows that the seven highest-risk states face potential combined hurricane damages exceeding $100 billion annually based on current storm frequency and intensification trends. Marsh McLennan analysis reveals that Hurricane Helene caused $10-20 billion in damages in Georgia in 2024, while Alabama experienced $500 million to $1 billion in hurricane-related costs, demonstrating how even less frequent storms can create massive economic impacts.
Advanced Forecasting Technology Improves Warning Systems
The National Hurricane Center has implemented artificial intelligence systems that help predict rapid intensification events, giving communities more warning time before dangerous storms arrive. NOAA’s Hurricane Research Division reports that modern probability models incorporate satellite data, ocean temperature readings, and atmospheric pressure patterns to generate more accurate forecasts. However, emergency management officials note that improved forecasting capabilities are offset by continued population growth in hurricane-prone areas, creating situations where more people receive better warnings about storms that are becoming more intense due to climate change factors.